
Knowing what happens on your website is hard. You can have all the user data in the world but no idea what to do with it, no process to manage it, and no way to filter the signal from the noise. Where do you even start? And once you begin, where do you go? What you need is a systemized approach — and the right tools.
When it comes to knowing, traditionally there have been two approaches you can take. The first is the quantitative approach. Quantitative analytics puts everything in terms of numbers. Number of users doing whatever — bounce rates, conversion rates, time on site … that kinda thing. Quantitative research is a squeaky clean way to crunch numbers and look at things at a high level.
The drawback to quantitative data is that much can be lost in translation. Important nuances are lost. (What determines a functional analytics tool is a subject for another day, but no matter what, the analytics tools you choose should serve your needs and budget.) And in the absence of information, the quantitative can play tricks on our pattern-recognizing brains. We can see things that just aren’t there — just like how we can see faces in objects.

The first few results for the Google Image Search for “faces in objects” do not disappoint.
To really know what happens on your website or web application, you need a way to get at that nuance. And that’s where the second approach comes in — the qualitative. Qualitative analysis focuses on the subjective qualities of your users — the nuanced actions that drive the numbers. It’s descriptive research. The qualitative approach is subjective, too. The user paused here. Raged there. They seem confused with this UI: what’s going on? Qualitative data is messy. But it is rich in insights.
The major problem with qualitative research methods is they occur at the individual level. Qualitatively researching every user who visits your site is impossible. You could never do it, nor would it be useful.
So what do you do? Use both.

The best analyses combine quantitative and qualitative research to create a flywheel of continuous product improvement. You use quantitative information to focus attention on the biggest problems (and opportunities) and then “zoom in” to the level of the user through qualitative research to round out your understanding — and solve the problem.
This one-two research method spins out insights you can turn into actions. It’s a quantitative-qualitative flywheel that can be used for continuous improvement of your website or app.
Here’s how it works …
Quantitative data alerts you to problems. Start here.
The most basic web analytical tools available are quantitative — and free. It comes as no surprise that one of the first things website owners do on launching a new site is install Google Analytics (GA).
Quantitative analytical tools like GA do a reliable job providing high-level metrics — e.g. user info, page visits, events, conversion rates, bounce rates, time on site, etc. Most importantly, they allow you to see the status of different aspects of your site and help you focus on problems or opportunities in aggregate.
With a functional quantitative analytics tool up and running, you’re ready to identify issues and opportunities for improvement. This is the first step in building the quantitative-qualitative flywheel. (Also see our discussion on if user metrics make you heartless.)
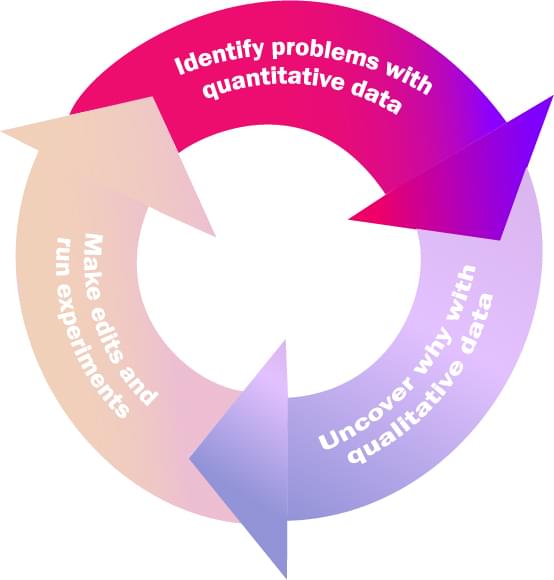
The Quantitative-Qualitative Flywheel starts with identifying problems through quantitative analysis.
Once you have a quantitative tool tracking your customer data, you can quickly be dazzled by the illusion of insights. Fight the tendency to be hypnotized by the show.
Come at your newfound quantitative data powers with an objective. Otherwise, you can easily be overwhelmed.
Consider these changes in quantitative metrics that left teams struggling to understand the why behind the quantitative what:
- An increase in customer churn seen by Wistia couldn’t be explained or reproduced. Why were customers churning?
- Decreased usage of certain features, like the customer service software company Kayako saw on analyzing feature adoption. Why weren’t customers trying out new features?
- Increased page bounces, seen by the translation service SpanishDict on their home page. What was breaking at the moment of first engagement?
Remember: behind every quantitative metric is a customer trying to get some job done. All you need to figure out is what that job is. And to do that, build out the next step in your flywheel.
Qualitative data gives you the why
Having used quantitative analysis to identify problems that require additional analysis, you need a way to “zoom in” on individual user behavior. That’s why you need a qualitative analytics tool.
Qualitative data can provide you with a firehose of nuanced information about individual user behaviors. It’s the most dense level of data, and it’s what you get through session replay. Using a qualitative analytics tool, you can see how individual users interact with your product.
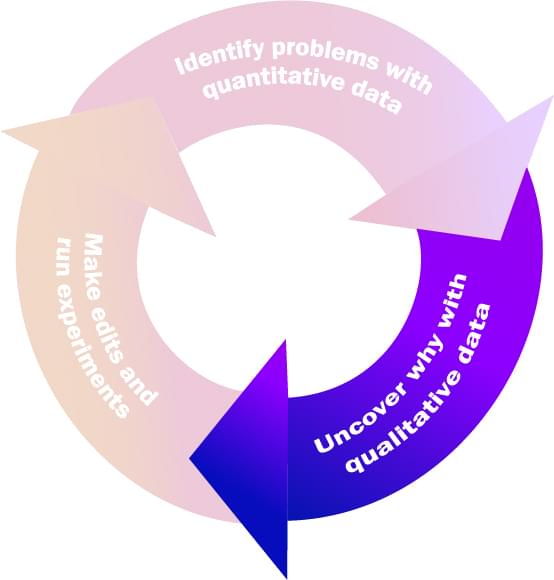
The second step in the Quantitative-Qualitative Flywheel is to use qualitative analysis to understand behaviors at the individual level.
How does it work? How do you go from quantitative data to qualitative research? Using a tool like FullStory, you can search the entire catalog of user behaviors on your site for just those that would affect whatever quantitative data you’re researching.
Continuing from our company examples above, qualitative data was used to uncover the why behind the change in quantitative data:
- Rage clicking indicated to Wistia that much of their customer churn was caused by confusion about how to use the product.
- Observing that most users skipped onboarding shed a light on why Kayako users didn’t know about certain features or couldn’t figure out how to use them.
- Seeing the site layout from the user’s perspective helped SpanishDict see that users couldn’t figure out how to get started because a banner ad was blocking the search bar.
In each of the above cases, qualitative research (completed using FullStory) provided the additional insights necessary to make sense of the problems identified through other quantitative tools.
Having used qualitative research to understand why you’re seeing changes in quantitative data, it’s time for action.
Experiment and check for improvements
Armed with a complete view of the user from the individual to the aggregate, you now have the insight you need to do something, and that something is to make edits and run experiments. This is the last step in the quantitative-qualitative flywheel.
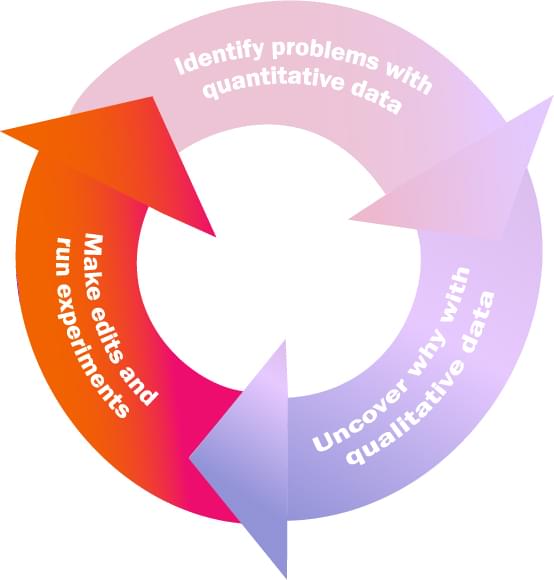
Once you thoroughly understand the problem through quantitative and qualitative analysis, make the needed edits or run experiments.
Just what edits are required will vary greatly depending on the problem you’re solving. Make the edits, run the experiments (A/B testing is helpful here), and then measure your results.
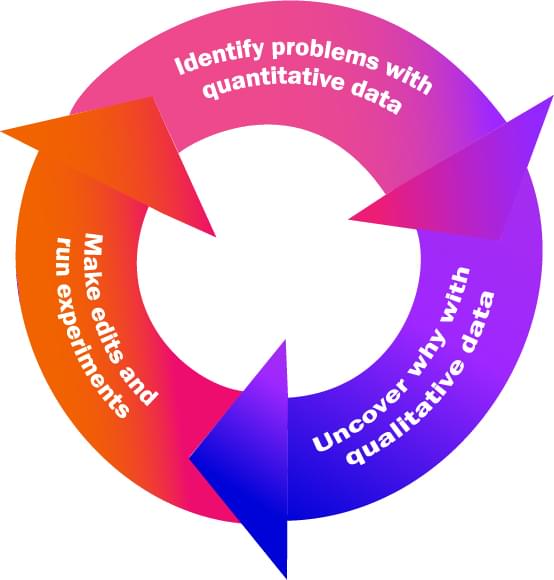
You’re back at the top of the flywheel, and on and on we go.
Full circle
Rather than qualitative vs quantitative, perhaps analysts should use the two together.
Quantitatively identifying problems in aggregate and then qualitatively understanding the underlying behaviors behind those problems has become a critical workflow that drives product improvements:
- For Wistia, user confusion about how to use the product was reduced by through allocating additional resources to customer support.
- Kayako learned that they needed to overhaul their user onboarding, and designed a completely new onboarding flow to guide users through the part of the product they were most interested in.
- SpanishDict increased engagement by moving the ad banner that was blocking the search bar to optimize for mobile users.
The quantitative-qualitative flywheel ensures your brain will never have to scramble to fill in gaps. The best qualitative and quantitative analytics tools work together to reveal the full story of user behavior on your site.
Put the flywheel to work and reap the rewards of an improved customer experience on the web.
Hello World !!!!
ggfhfhghgfhgfhfgh
Hello World !!!!!
Hi From Here ………….
kman comment